
The NOVA food classification system
NOVA is a food classification developed at the University of São Paulo that groups foods into four categories by the extent and purpose of industrial processing, not by nutrients — and it is now used by PAHO, the FAO, and national dietary guidelines in Brazil, France, Israel, and Belgium.
What is the NOVA classification system?
NOVA is a food classification developed by Carlos Monteiro and colleagues at the University of São Paulo that sorts foods into four groups based on the extent and purpose of industrial processing rather than nutrient content. First published in the World Nutrition journal in 2009 and formalised in Public Health Nutrition (2019;22[5]:936–941), NOVA is now referenced by the Pan American Health Organization (PAHO 2015 dietary guidance) and the UN Food and Agriculture Organization (FAO 2019 report on ultra-processed foods). National dietary guidelines in Brazil (2014), Uruguay (2016), Ecuador (2018), France (2019), Israel (2019), and Belgium (2019) explicitly cite the framework.
NOVA is a taxonomy, not a verdict. It describes what was done to a food before it reached the shelf — the degree of processing (a hypernym covering physical, biological, and chemical techniques) and the purpose (preservation, palatability, or industrial formulation). The synonym readers often see, "processing level", refers to the same concept.
What are the four NOVA groups?
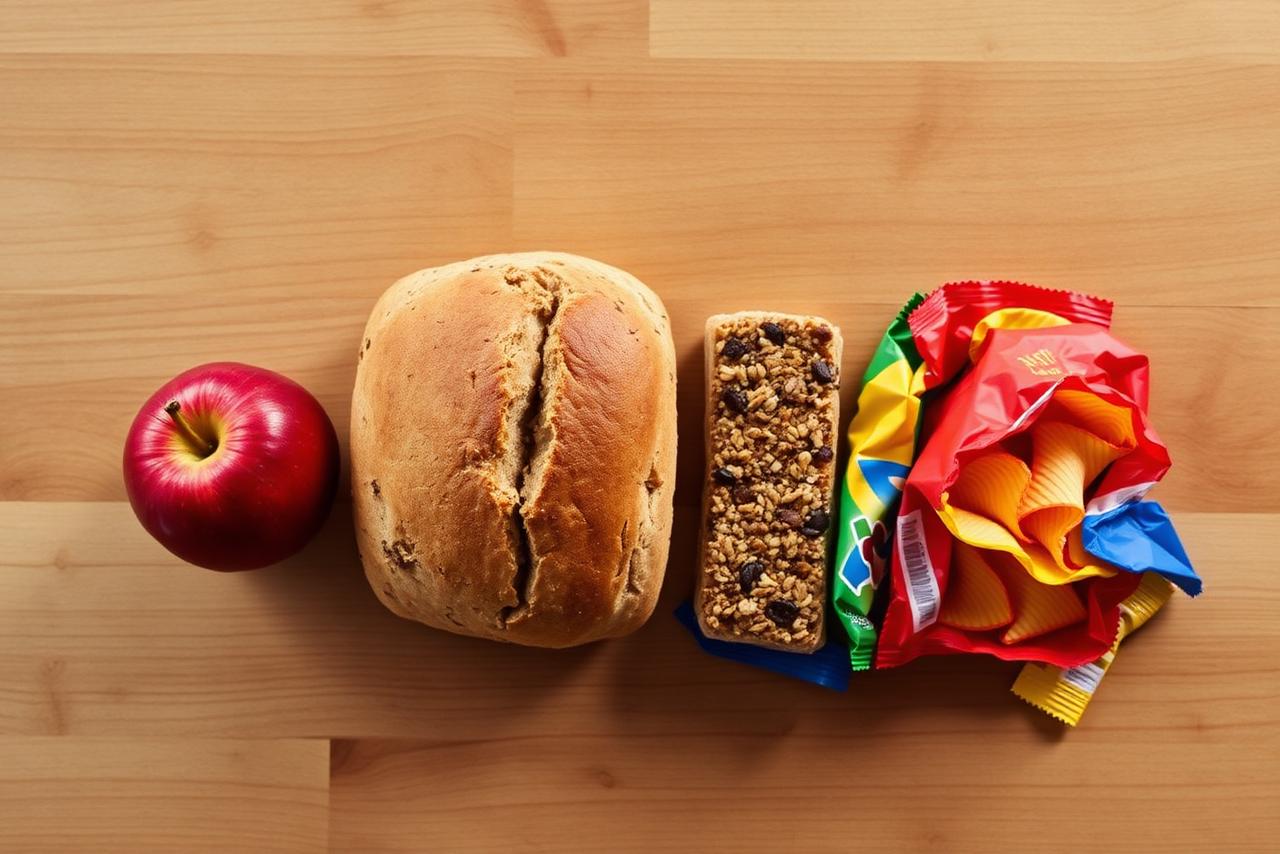
Group 1 covers unprocessed and minimally processed foods; Group 2 covers processed culinary ingredients; Group 3 covers processed foods; Group 4 covers ultra-processed foods — industrial formulations built from substances extracted from foods plus additives. The four-group structure is defined in Monteiro et al. 2019 (op. cit.) with worked examples in the PAHO 2015 guidance (pages 12–19).
| Group | Definition | Everyday examples |
|---|---|---|
| 1 — Unprocessed / minimally processed | Edible parts of plants or animals, altered only by drying, grinding, chilling, fermenting, or pasteurisation. | Apples, brown rice, plain milk, eggs, dried beans, oats. |
| 2 — Culinary ingredients | Substances extracted from Group 1 foods or from nature, used to cook Group 1 items at home. | Table salt, sugar, olive oil, butter, vinegar. |
| 3 — Processed | Group 1 foods preserved or enhanced with Group 2 ingredients — usually 2–3 ingredients on the label. | Canned tomatoes, aged cheese, tinned fish, artisanal bread. |
| 4 — Ultra-processed | Industrial formulations of substances extracted from foods plus additives; typically 5+ ingredients including cosmetic additives. | Soft drinks, packaged snacks, most breakfast cereals, instant meals. |
Why does NOVA classify by processing, not by nutrients?
Because the physical and chemical structure of a food — its "food matrix" — changes how the body digests and responds to it, independent of the calorie and macronutrient totals printed on the label. Fardet (2015; Food & Function 6, 363–382) reviewed 12 human trials and reported satiety scores 20–40% higher for whole-food meals matched for macronutrients against ultra-processed comparators. The Hall et al. randomised feeding trial (Cell Metabolism 2019;30[1]:67–77, n = 20) found participants ate 508 kcal/day more on the UPF diet than on the whole-food diet even when both were matched for calories offered, sugar, fat, fibre, and macronutrients.
This is why two products with identical nutrition panels can produce different glycemic, hormonal, and microbiome responses. The matrix difference — meronyms include intact cell walls, fibre encapsulating starch, and protein–lipid complexes — is destroyed by extrusion, milling, and industrial emulsification typical of Group 4 processing.
What research supports the NOVA framework?
The evidence base is now more than 30 prospective cohort studies covering over 1 million adults, plus one landmark randomised feeding trial, all pointing in the same direction after adjusting for calories and macros.
| Study | Outcome | n | Effect (highest vs lowest UPF quartile) |
|---|---|---|---|
| Rico-Campà A, et al. BMJ 2019;365:l1949 | All-cause mortality | 19,899 | HR 1.62 (95% CI 1.13–2.33) |
| Srour B, et al. BMJ 2019;365:l1451 | Cardiovascular disease | 105,159 | HR 1.12 per 10% UPF increase |
| Fiolet T, et al. BMJ 2018;360:k322 | Cancer (overall) | 104,980 | HR 1.12 per 10% UPF increase |
| Hall KD, et al. Cell Metab 2019;30:67–77 | Ad-libitum energy intake (RCT) | 20 | +508 kcal/day on UPF vs whole foods |
| Lane MM, et al. BMJ 2024;384:e077310 | Umbrella review, 45 meta-analyses | 9.9M | Convincing evidence for 32 adverse outcomes |
The 2024 umbrella review by Lane and colleagues in the BMJ (2024;384:e077310) consolidated 45 meta-analyses covering approximately 9.9 million participants and rated the evidence "convincing" for direct associations between UPF exposure and 32 adverse health outcomes, including all-cause mortality, cardiovascular disease, type 2 diabetes, and common mental disorders. This is the strongest published summary to date and it uses NOVA as its exposure classification.
What are the criticisms and limits of NOVA?
NOVA is a descriptive taxonomy, not a mechanistic model — it does not identify which specific processes or additives drive the observed associations, and its Group 4 boundary depends on judgement. Gibney (Advances in Nutrition 2019;10[4]:717–724) and Astrup & Monteiro (American Journal of Clinical Nutrition 2022;116[6]:1476–1481) published a formal exchange on the framework's weaknesses. The main critiques:
- Group 4 is heterogeneous — a diet soda and a frozen lasagne share the group but differ chemically.
- Classification depends on ingredient-list reading, which introduces inter-rater variability estimated at 5–15% (Braesco V, et al. European Journal of Clinical Nutrition 2022;76:1245–1253).
- Observational studies cannot separate processing from correlated exposures such as low fibre, high sodium, or advertising-driven overconsumption.
Most published critiques accept the association between UPF intake and chronic disease while asking for finer-grained categorisation. The Monteiro group has published clarifications in Public Health Nutrition (2019 and 2021) but has kept the four-group structure intact.
How does NakedCalorie use NOVA?
The food-quality score weights the NOVA group as one of three inputs, alongside additive flags and residue signals, and always surfaces the underlying reason next to the number. A Group 1 whole food starts near the top of the processing axis; each Group 2 or Group 4 marker on the ingredient list lowers it. The score UI never reads as a verdict — it shows the group, the specific flagged additives, and links back to the source article. See What's inside for the full methodology, or read the Group 4 ultra-processed foods article for the deepest cluster inside NOVA.
Frequently asked questions
- Is NOVA the same as NutriScore?
- No. NutriScore rates foods A–E based on calories, sugar, saturated fat, sodium, protein, fibre, and fruit/vegetable content. NOVA classifies by degree and purpose of industrial processing. A product can score NutriScore A and still be NOVA Group 4 — for example a diet soda or a low-sugar breakfast cereal fortified with vitamins.
- Who created the NOVA system?
- NOVA was developed by Carlos Monteiro and colleagues at the Center for Epidemiological Research in Nutrition and Health at the University of São Paulo, first published in 2009 and refined in Public Health Nutrition (2019;22[5]:936–941). It is now used by the Pan American Health Organization and the FAO.
- Does NOVA say ultra-processed foods are dangerous?
- NOVA itself is a descriptive taxonomy — it doesn't rank foods as safe or dangerous. Large cohort studies that use NOVA (Rico-Campà 2019 BMJ; Srour 2019 BMJ; Fiolet 2018 BMJ) associate higher Group 4 intake with worse outcomes, but NOVA classification and health risk are separate questions.
- Are all Group 4 foods equally ultra-processed?
- No. Group 4 spans a wide range of formulations — a diet soda and a frozen lasagne share the classification but differ chemically. Researchers including Gibney (2019) have argued for finer-grained subcategories; the Monteiro group has published clarifications but kept the four-group structure intact.
- How does NakedCalorie use NOVA in the score?
- NOVA is one of three inputs to the food-quality score, alongside additive flags and residue context. The app never labels a food 'bad' — it displays the group, the flagged additives, and links to the primary source for every claim.
Written by NakedCalorie editorial team.
Medically reviewed by Pending registered dietitian review — last reviewed July 1, 2026.
Educational information only, based on peer-reviewed literature and regulatory sources. Not medical advice.
Related in the knowledge base